|
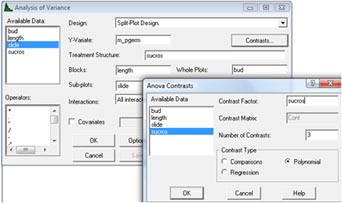
The mean data set CS9Data1b was first used and the model:
length + bud / length + sucrose
fitted by Stats → Analysis of Variance… and
selecting 'Split-Plot Design'. By clicking contrasts and selecting polynomials up to the cubic
(see below)
the output shown is produced.
Notice how two random sources of variation have been obtained: 'length.bud.stratum' and 'Residual'.
|
|
**** Analysis of variance *****
Variate: m_pgerm
|
Source of variation
|
d.f
|
s.s.
|
m.s.
|
v.r.
|
|
length stratum
|
2
|
150.57
|
75.28
|
0.43
|
|
length.bud stratum
|
3
|
524.32
|
174.77
|
1.82
|
length.bud.slide stratum
|
sucros
|
7
|
15548.17
|
2221.17
|
23.17
|
| Lin
|
1
|
9784.53
|
9784.53
|
102.06
|
| Quad
|
1
|
5170.69
|
5170.69
|
53.93
|
| Cub
|
1
|
19.27
|
19.27
|
0.20
|
|
Deviations
|
4
|
573.67
|
143.42
|
1.50
|
|
Residual
|
35
|
3355.50
|
95.87
|
|
| Total
|
47
|
19578.55
|
|
|
*** Tables of means ***
|
sucros
|
0.0
|
5.0
|
10.0
|
15.0
|
20.0
|
25.0
|
30.0
|
|
5.3
|
19.9
|
36.1
|
52.6
|
58.3
|
50.7
|
58.3
|
| sucros
|
35.0
|
|
|
|
|
|
|
|
|
45.6
|
|
|
|
|
|
|
***Standard errors of differences of means***
| Table |
sucros
|
| rep. |
6
|
| d.f |
35
|
| s.e.d |
5.653
|
|
|